


Behind every successful construction project lies a complex story of planning, execution, and precision a narrative of timelines, budgets, resources, and risks. Yet, in many construction firms, this story gets fragmented across countless spreadsheets, siloed reports, and disjointed project updates.
The Power BI Construction Management Dashboard transforms these scattered project narratives into a unified, actionable story. It converts raw project data into a dynamic, real-time view of your operations, revealing which projects are on track, where bottlenecks are forming, and how resources are being utilised across your portfolio.
Imagine seeing the complete project landscape, from overall budget health and schedule adherence to subcontractor performance and safety compliance, all in one intuitive, visual interface. With this Construction Management Dashboard, project managers and company leaders can shift from reactive firefighting to proactive project strategy—where every percentage point reflects progress, and every insight drives timely, informed decisions.
Explore key construction management insights, beautifully visualised, including project financials, schedule variance, resource allocation, safety incident rates, subcontractor performance, and overall project portfolio health.
Benefits of this Construction Management Dashboard Power BI Template
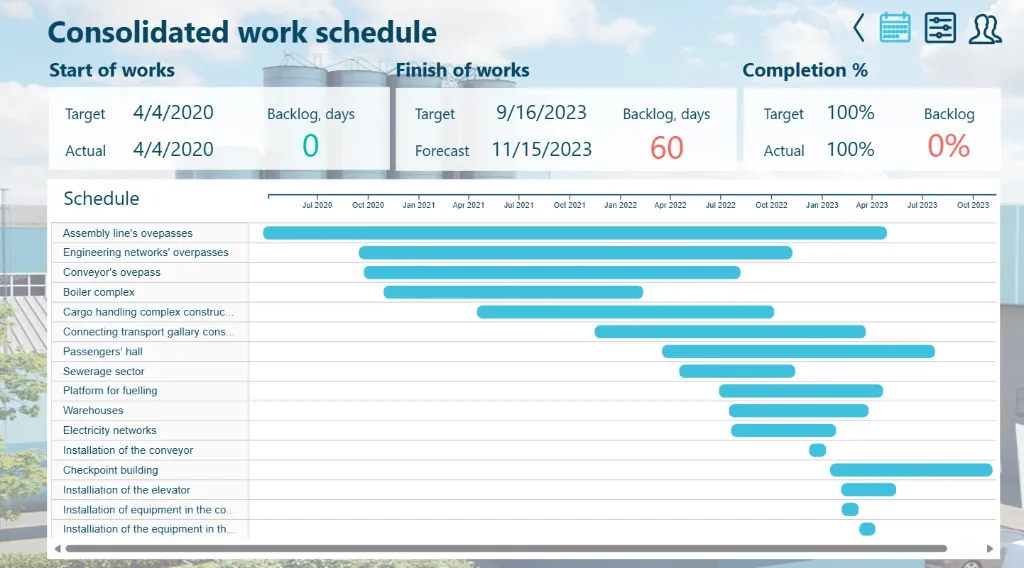
Get a single-pane, 360-degree project portfolio view of all ongoing projects, including budget tracking and schedule adherence.
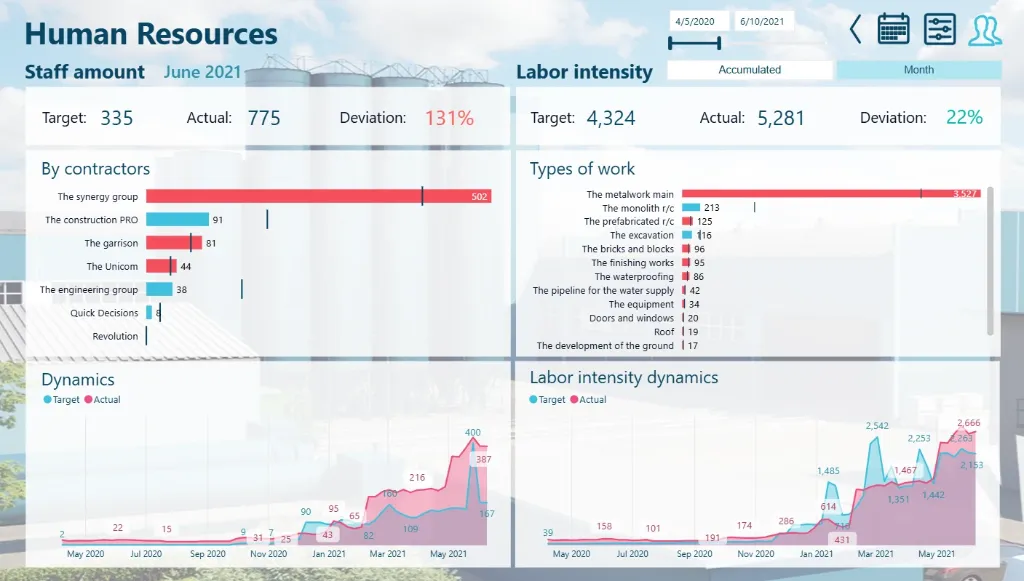
To maximise your resource allocation and mitigation strategies, identify potential project risks and cost overruns.
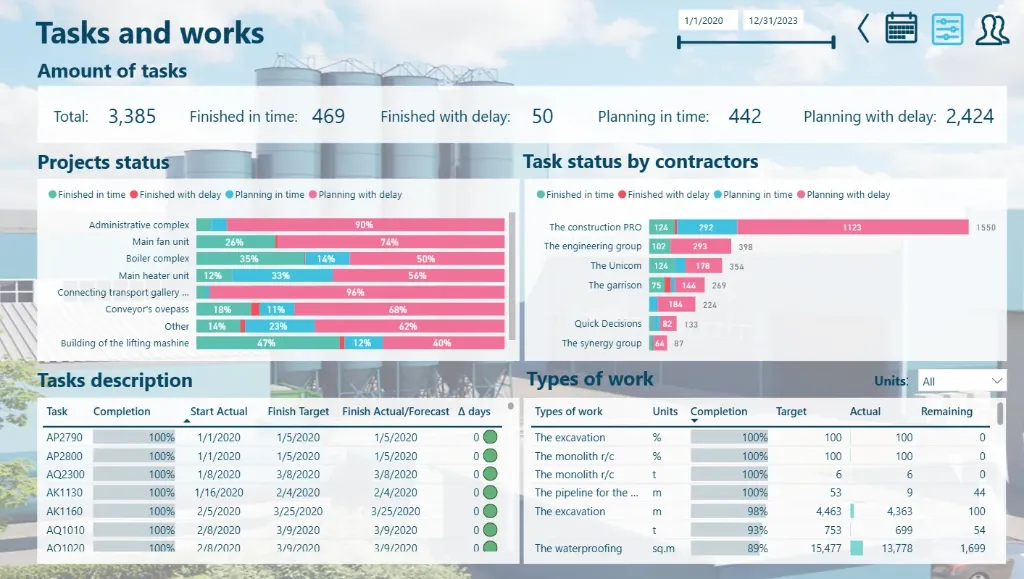
Clear visual comparisons of planned versus actual costs and schedule variance can be used to assess project performance.
Increase project forecasting accuracy by using data-driven insights into material costs and labour productivity.
Improve stakeholder reporting with a Power BI-based executive-level KPI dashboard that is ready to present.
An automated, fully editable construction analytics template can save countless hours of labour-intensive manual data compilation.
Who Can Use This Template
Superintendents and project managers can quickly monitor resource allocation, budget compliance, and project schedules.
Construction executives and vice presidents should keep an eye on safety metrics, company-wide profitability, and portfolio performance.
Safety officers should evaluate all sites' incident rates, compliance levels, and advancements in safety training.
Construction analysts and consultants can use it as a ready-made, expert template for strategic planning and client presentations.
How to Use This Template
The Power BI Construction Management Dashboard Template (.pbix) file can be downloaded.
In Microsoft Power BI Desktop, open it.
Use the accompanying User Guide PDF to link your project management software, accounting systems, and safety databases.
Tailor metrics, graphics, and filters to your particular project types, safety procedures, and reporting needs.
To automatically produce updated project insights and performance analytics for stakeholder meetings and strategic reviews, refresh the dashboard.
Detailed Description: Construction Analytics Made Simple
The Power BI Construction Management Dashboard creates a cohesive narrative by combining all of the key project management metrics. This dashboard provides a comprehensive 360° view of your construction operations with detailed visuals for budget variance, schedule performance, safety incident rates, subcontractor evaluations, and resource utilisation. Project teams and business executives can monitor the health of a project from inception to completion, determine which projects are yielding the highest profit margin, and identify possible budgetary and safety risks. This dashboard allows you to go beyond dispersed reports and make every operational decision data-driven and safety-focused, whether you're evaluating crew productivity or allocating your equipment optimally.
Business Impact of Construction Insights in Power BI
This dashboard template transforms construction project data into your most valuable strategic asset. Organisations using it gain:
Enhanced profitability through early detection of cost overruns and efficient resource distribution among projects.
Improved safety performance via proactive risk assessment and compliance tracking.
Improved project outcomes through real time monitoring of budget and schedule compliance.
Making well-informed decisions with a clear understanding of equipment usage and subcontractor performance.
Strategic advantage through executive ready graphics that link project activities to business results.
It's more than a dashboard it's your construction command centre for delivering projects on time, within budget, and with zero safety incidents.
What's Included
Template file (.pbix) for the Power BI Construction Management Dashboard
Excel sample dataset (for demonstration)
Complete User Guide in PDF format with setup guidelines
Support for personalisation is offered upon request.
Technical Details
File Type: pbix
Software Needed: Microsoft Power BI Desktop (Free)
Data Source Compatibility: major construction management platforms via API connections, Excel, CSV, and SQL databases
Compatibility: The most recent version of Power BI Desktop is advised.
Proficiency Level: Novice to Expert Users
Customize Dashboard at an Affordable Price
Frequently asked questions
Yes. The included User Guide PDF provides step-by-step instructions on how to connect the dashboard and update it with your own data sources quickly and easily.
The dashboard reflects the data you connect and refresh. For true real-time data streaming, this can be enabled with a Power BI Pro/PPU license and a custom data gateway setup (assistance available upon request).
Absolutely. The dashboard is fully editable within Power BI Desktop. You can modify visuals, add or remove Key Performance Indicators (KPIs), and adjust filters to meet your specific reporting needs.
The template comes pre-built with a comprehensive set of relevant metrics for its category, such as performance trends, conversion rates, cost analysis, and demographic breakdowns. The specific list is detailed in the dashboard description.
No. You can open, edit, and interact with the dashboard using the free Power BI Desktop application. A Power BI Pro or Premium Per User (PPU) license is only required to share and publish reports securely with other users within your organization.