

Behind every successful business lies a portfolio of customer relationships, each with its own story of discovery, engagement, and growth. Yet, in many organizations, these stories are fragmented across disconnected systems and static sales reports.
This Power BI CRM Dashboard Template turns those hidden customer stories into powerful insights. It transforms raw sales and service data into a living narrative of your customer journey, revealing which leads are converting, where opportunities are stalling, and how your team is nurturing key accounts.
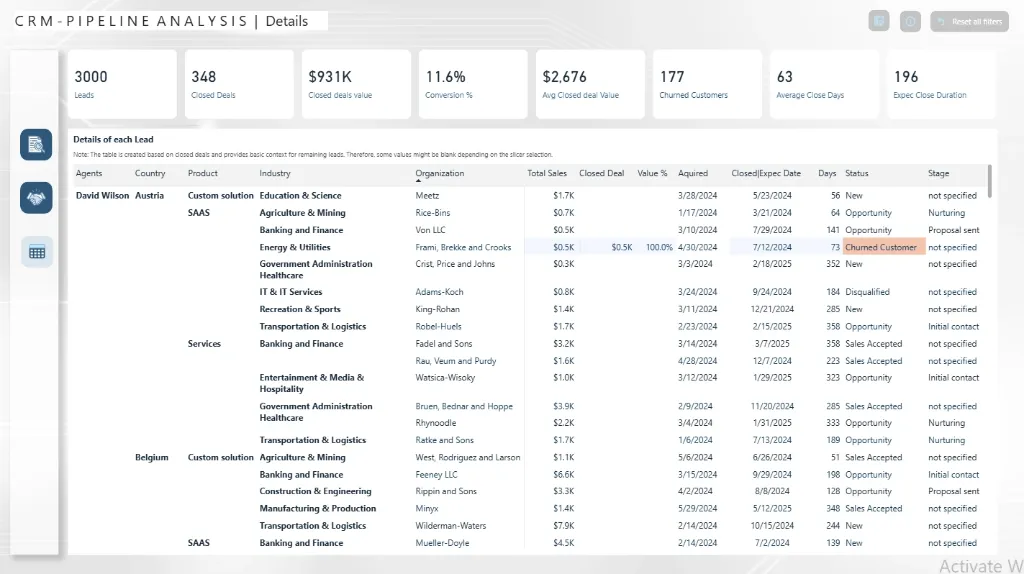
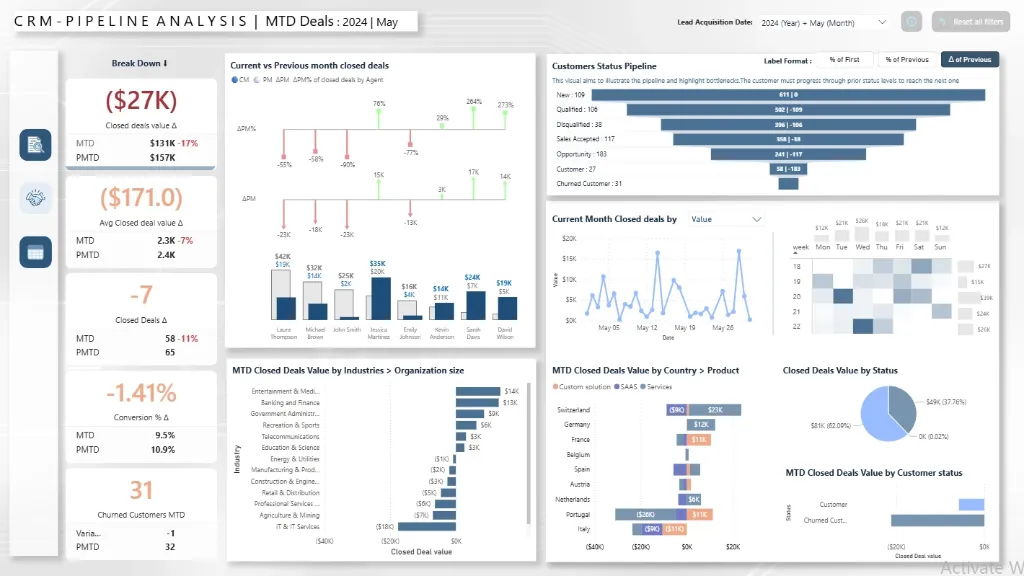
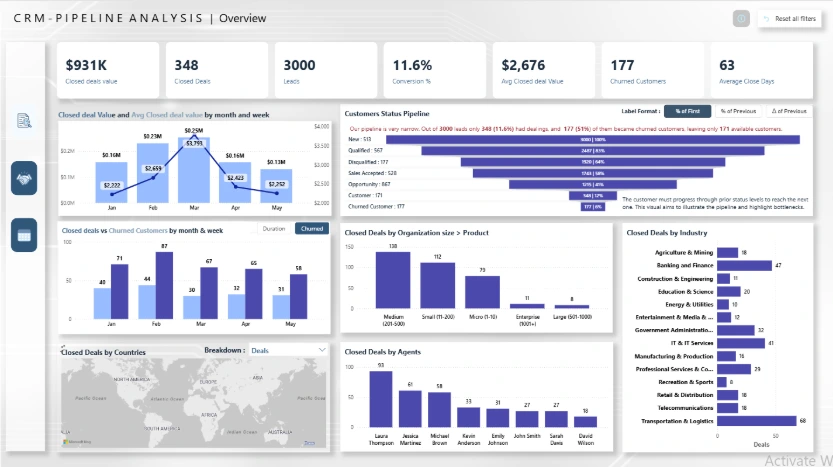
Imagine seeing the complete picture, from your sales pipeline health and lead conversion rates to customer satisfaction scores and support ticket trends, all in one dynamic view. With this CRM analytics dashboard, sales and service leaders can finally move from reactive reporting to proactive customer strategy, where every number reflects a relationship, and every insight drives retention and revenue.
Explore key customer insights, beautifully visualized, including sales pipeline value, lead conversion rates, customer satisfaction (CSAT) scores, support ticket volume by priority, and agent performance metrics.
Benefits of this CRM Analytics Dashboard Power BI Template
Get a unified 360° customer view across sales, service, and marketing interactions in a single pane.
Identify high-value sales opportunities and at-risk accounts to optimize your revenue strategy and resource allocation.
Measure team performance with clear visual comparisons of conversion rates, sales cycle length, and deal win/loss analysis.
Enhance customer retention tactics with data-driven insights into satisfaction ratings and support ticket trends.
Improve executive reporting with a Power BI-based interactive KPI dashboard that is ready to present.
An automated, fully editable customer analytics template can save many hours of laborious manual data compilation.
Who Can Use This Template
Sales managers and vice presidents can quickly monitor team performance, pipeline health, and revenue projections.
Customer service leaders should keep an eye on trends in customer satisfaction (CSAT), agent productivity, and the volume of support tickets.
CEOs and business executives should coordinate customer operations with overarching business growth goals.
For stakeholder presentations and strategic planning, revenue operations analysts can utilise it as a ready-made, expert analytics template.
How to Use This Template
Get the Power BI CRM Analytics Dashboard Template (.pbix) file.
Use Microsoft Power BI Desktop to open it.
Use the attached User Guide PDF to connect your CRM data sources (Salesforce, HubSpot, Zoho).
Adapt metrics, graphics, and filters to your unique KPIs and business processes.
To automatically produce updated customer insights and distribute them throughout your company, refresh the dashboard.
Detailed Description: Customer Analytics Made Simple
The Power BI CRM Analytics Dashboard creates a cohesive narrative by combining all of the crucial customer relationship metrics. This dashboard provides a full 360° view of your customer lifecycle with detailed visuals for sales pipeline value, lead conversion rates, customer satisfaction scores, support ticket resolution times, and revenue trends. From initial contact to devoted advocacy, sales and service teams can monitor customer interactions, determine which segments offer the greatest value, and identify possible hazards in the customer journey. This dashboard allows you to go beyond dispersed customer data and make every business decision customer-centric and insight-driven, whether you're evaluating the performance of your sales team or streamlining customer service operations.
Business Impact of Customer Insights in Power BI
Customer data is transformed into your most valuable strategic asset with this dashboard template. Organizations using it gain:
Increased Revenue by focusing on high-conversion opportunities and optimizing sales processes.
Improved Customer Retention through proactive identification of at-risk accounts and service issues.
Higher Team Productivity by streamlining reporting and highlighting performance bottlenecks.
Improved resource allocation through support workload distribution and transparent visibility into sales territories.
Data driven strategy that links customer operations to business outcomes through executive ready visuals.
It serves as your company's command centre for fostering enduring client relationships and promoting sustainable growth, making it more than just a dashboard.
What's Included
Template file (.pbix) for the Power BI CRM Analytics Dashboard
Excel format sample dataset (for demonstration)
Complete User Guide in PDF format with setup guidelines
Customisation support is available upon request.
Technical Details
File Type: pbix
Software Needed: Microsoft Power BI Desktop (Free)
Data Source Compatibility: Major CRM platforms via API connections, Excel, CSV, and SQL databases
Compatibility: Power BI Desktop (the most recent version is advised)
Skill Level: Beginner to Intermediate users
Customize Dashboard at an Affordable Price
Frequently asked questions
Yes. The included User Guide PDF provides step-by-step instructions on how to connect the dashboard and update it with your own data sources quickly and easily.
The dashboard reflects the data you connect and refresh. For true real-time data streaming, this can be enabled with a Power BI Pro/PPU license and a custom data gateway setup (assistance available upon request).
Absolutely. The dashboard is fully editable within Power BI Desktop. You can modify visuals, add or remove Key Performance Indicators (KPIs), and adjust filters to meet your specific reporting needs.
The template comes pre-built with a comprehensive set of relevant metrics for its category, such as performance trends, conversion rates, cost analysis, and demographic breakdowns. The specific list is detailed in the dashboard description.
No. You can open, edit, and interact with the dashboard using the free Power BI Desktop application. A Power BI Pro or Premium Per User (PPU) license is only required to share and publish reports securely with other users within your organization.