


Behind every efficient facility and sustainable operation lies a detailed story of energy flow, consumption patterns, and cost management. Yet, in many organizations, this critical narrative remains hidden within complex utility bills, meter readings, and manual tracking logs.
The Power BI Electricity Usage Dashboard turns this hidden energy story into a powerful tool for operational and financial insight. It transforms raw consumption data into a clear, actionable narrative of your energy footprint, revealing where power is being used, when demand peaks occur, and how costs are accumulating across your operations.
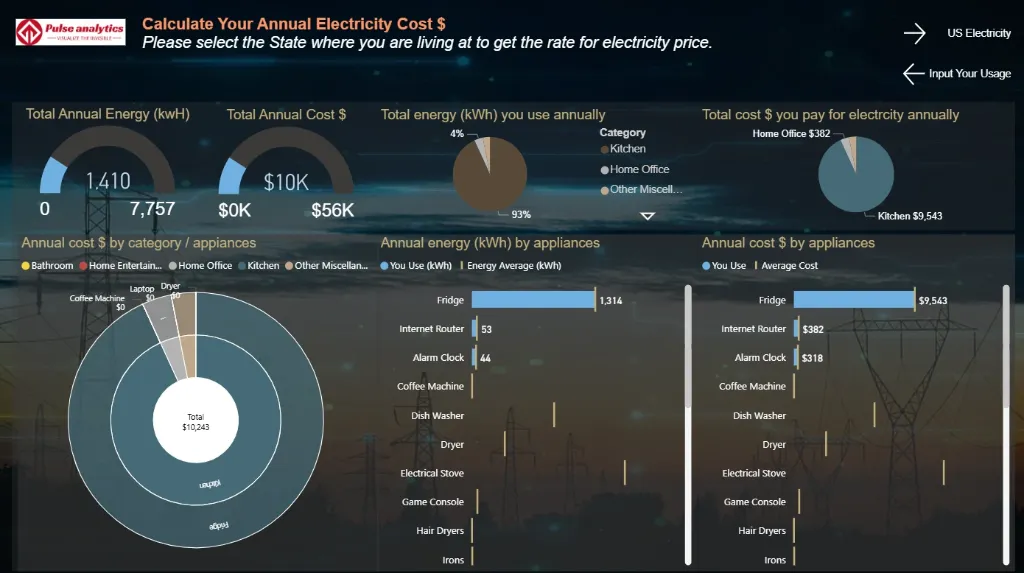
Imagine seeing the complete energy picture, from real-time consumption trends and cost variance analysis to sustainability metrics and peak load forecasting, all in one dynamic visual interface. With this analytics dashboard, facility managers and sustainability leaders can finally transition from reactive bill-paying to proactive energy strategy—where every kilowatt-hour is accounted for, and every insight drives efficiency and savings.
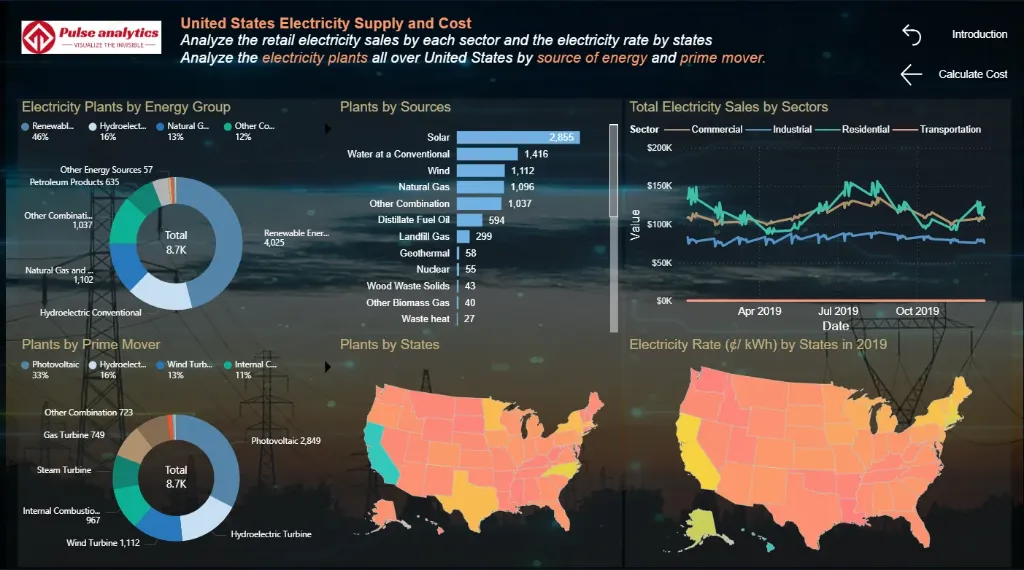
Explore key energy management insights, beautifully visualized, including hourly consumption trends, cost-per-unit analysis, peak demand tracking, departmental usage breakdowns, forecast versus actual usage, and sustainability impact metrics.
Benefits of this Electricity Usage Dashboard Power BI Template
Get a unified 360° view of energy consumption across all meters, buildings, and departments in a single pane.
Identify usage anomalies and peak demand patterns to optimize load scheduling and reduce demand charges.
Measure energy efficiency with clear visual comparisons of consumption trends, cost variance, and sustainability KPIs.
Improve budget forecasting with data-driven insights into seasonal usage patterns, rate changes, and operational impacts.
Enhance sustainability reporting with a ready-to-present, executive-level dashboard built on Power BI.
Save significant manual effort in utility bill analysis with an automated, fully editable energy analytics template.
Who Can Use This Template
Facility & Operations Managers to track real-time consumption, equipment efficiency, and utility costs across all locations.
Sustainability & ESG Officers to monitor carbon footprint, energy intensity metrics, and conservation progress.
Financial Controllers to analyze utility spend variance, budget adherence, and cost-saving opportunities.
Energy Consultants to use it as a pre-built, professional template for client energy audits and efficiency presentations.
How to Use This Template
Download the Power BI Electricity Usage Dashboard Template (.pbix) file.
Open it in Microsoft Power BI Desktop.
Connect your smart meter data, utility bills, and building management systems using the included User Guide PDF.
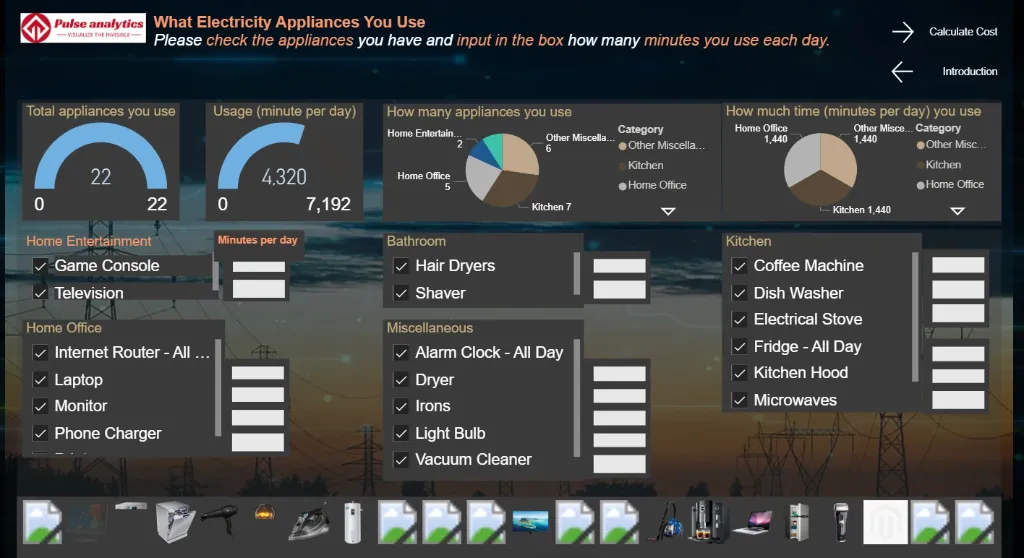
Customize metrics, visuals, and filters to match your specific meter hierarchy, rate structures, and reporting periods.
Refresh the dashboard to automatically generate updated consumption insights for operational reviews and strategic planning.
Detailed Description: Energy Analytics Made Simple
The Power BI Electricity Usage Dashboard consolidates all essential energy management metrics into a single, coherent story. With comprehensive visuals for consumption trends, demand patterns, cost analysis, peak load management, and savings tracking, this dashboard delivers a complete 360° view of your energy performance. Facility teams can track usage from the main service entrance down to individual circuits, identify which equipment or departments are the largest consumers, and uncover potential waste or inefficiencies. Whether you're responding to utility rate changes or implementing a demand response strategy, this dashboard enables you to move beyond monthly bills and make every energy decision data-driven and cost-optimized.
Business Impact of Energy Insights in Power BI
This dashboard template transforms utility data into a strategic asset for cost control and sustainability. Organizations using it gain:
Reduced Operational Costs by identifying energy waste and optimizing consumption patterns to lower utility bills.
Improved Budget Accuracy through advanced forecasting of energy needs based on historical and predictive analytics.
Enhanced Sustainability Performance by tracking and reporting on carbon emissions and energy conservation achievements.
Informed Capital Planning with data to justify energy efficiency upgrades and equipment replacements.
Regulatory Compliance with clear, auditable records of energy usage and conservation efforts.
It's more than a dashboard it's your facility's energy command center for driving down costs, minimizing environmental impact, and ensuring operational resilience.
What's Included
Power BI Electricity Usage Dashboard Template file (.pbix)
Sample Energy Dataset in Excel format (for demonstration)
Comprehensive User Guide PDF with step-by-step setup instructions
Support for customization available upon request
Technical Details
File Format: .pbix
Software Required: Microsoft Power BI Desktop (Free)
Data Source Compatibility: Excel, CSV, SQL Database, IoT platforms, and major building management systems through API connections
Compatibility: Power BI Desktop (latest version recommended)
Skill Level: Beginner to Intermediate users
Customize Dashboard at an Affordable Price
Frequently asked questions
Yes. The included User Guide PDF provides step-by-step instructions on how to connect the dashboard and update it with your own data sources quickly and easily.
The dashboard reflects the data you connect and refresh. For true real-time data streaming, this can be enabled with a Power BI Pro/PPU license and a custom data gateway setup (assistance available upon request).
Absolutely. The dashboard is fully editable within Power BI Desktop. You can modify visuals, add or remove Key Performance Indicators (KPIs), and adjust filters to meet your specific reporting needs.
The template comes pre-built with a comprehensive set of relevant metrics for its category, such as performance trends, conversion rates, cost analysis, and demographic breakdowns. The specific list is detailed in the dashboard description.
No. You can open, edit, and interact with the dashboard using the free Power BI Desktop application. A Power BI Pro or Premium Per User (PPU) license is only required to share and publish reports securely with other users within your organization.