


Behind every successful enterprise lies a financial narrative, a story of revenue streams, cost management, and strategic investments. Yet, in many organizations, this story remains hidden within complex accounting systems and static financial statements.
The Power BI Financial Performance Dashboard transforms these hidden fiscal narratives into powerful business intelligence. It converts raw accounting data into a compelling story of your organization's economic health, revealing which products are driving profitability, where operational efficiencies are being gained, and how your financial strategy is delivering results.
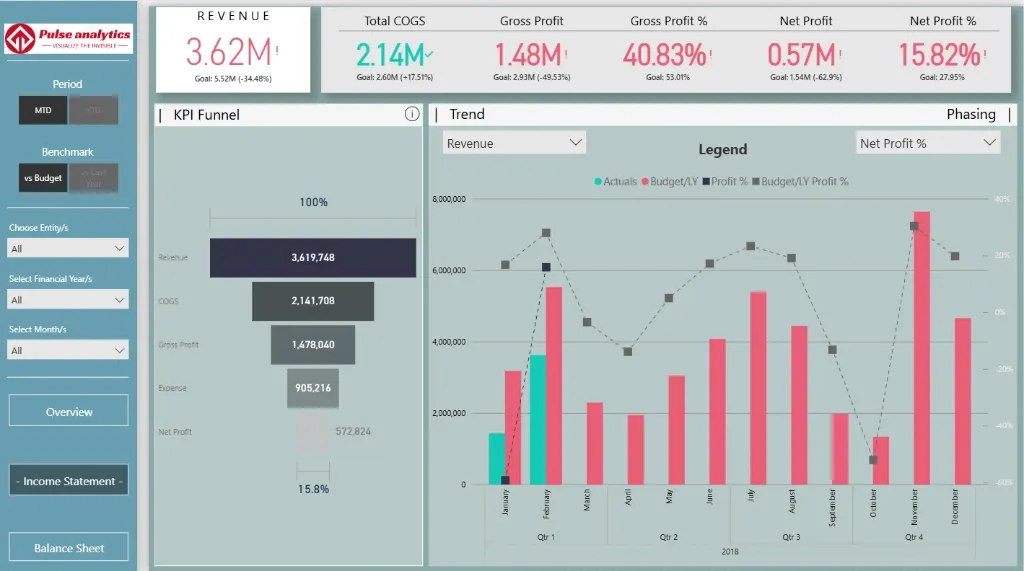
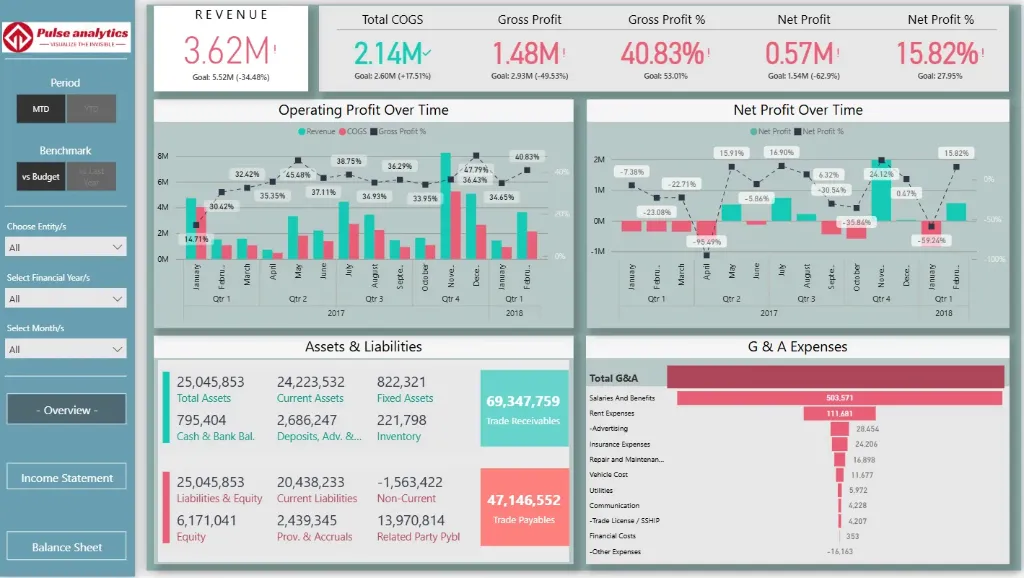
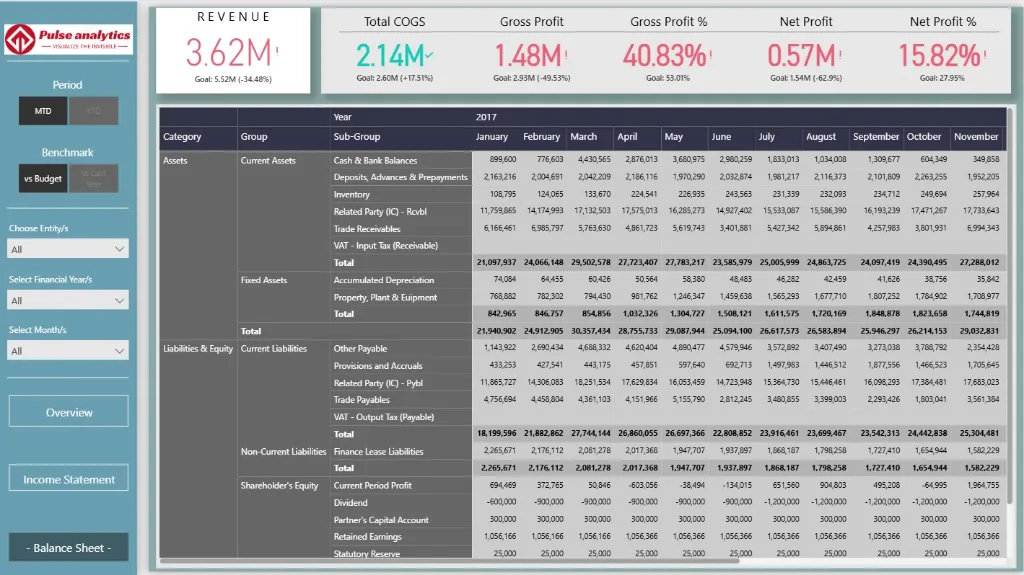
Imagine seeing the complete financial picture, from revenue growth trends and profit margin analysis to cash flow patterns and budget performance, all in one dynamic visual interface. With this comprehensive analytics dashboard, financial leaders and executives can finally transition from reactive reporting to proactive fiscal strategy, where every number tells a story of opportunity, and every insight drives financial excellence.
Explore key financial insights, beautifully visualized, including revenue and profit trends, expense analysis by department, budget versus actual performance, cash flow patterns, and financial ratio analysis across liquidity, profitability, and efficiency metrics.
Benefits of this Financial Performance Dashboard Power BI Template
Get a unified 360° financial view of your company's profitability, cash flow, and balance sheet health in a single, interactive pane.
Identify key profitability drivers and cost-saving opportunities to optimize your financial strategy and resource allocation.
Clear visual comparisons of revenue trends, expense ratios, and budget vs. actuals can be used to assess financial stability and growth.
Utilise data-driven insights into departmental spending, operational margins, and cash flow patterns to enhance financial planning and forecasting.
Improve stakeholder and board reporting with a Power BI-based executive-level KPI dashboard that is ready to present.
With an automated, fully editable financial analytics template, you can save countless hours on manual financial consolidation.
Who Can Use This Template
CFOs and finance directors can quickly monitor cash flow performance, profitability, and overall financial health.
Accountants and financial controllers to keep an eye on accurate financial reporting, expense analysis, and budget compliance.
Department heads and business executives should be aware of their P&L impact and make sure departmental spending is in line with strategic objectives.
For comprehensive financial reviews and stakeholder presentations, financial analysts and consultants can utilise it as a ready-made, expert template.
How to Use This Template
The Power BI Financial Performance Dashboard Template (.pbix) file can be downloaded.
Use Microsoft Power BI Desktop to open it.
Use the attached User Guide PDF to connect your data sources (ERP, accounting software, GL systems).
Customise financial metrics, charts, and filters to fit your unique reporting needs and chart of accounts.
When the dashboard is refreshed, updated financial statements and performance insights are automatically generated for period-end closing.
Detailed Description: Financial Analytics Made Simple
The Power BI Financial Performance Dashboard creates a single, cohesive story by combining all important financial metrics. This dashboard provides a full 360° view of the financial health of your company with detailed visuals for income statement trends, balance sheet summaries, cash flow statements, budget variance analysis, and important profitability ratios. Executives and finance teams can identify departments that have an impact on the bottom line, monitor revenue streams and cost structures, and identify financial opportunities and risks. With the help of this dashboard, you can go beyond static spreadsheets and make all financial decisions strategically sound and insight-driven, whether you're presenting to the board or closing the monthly books.
Business Impact of Financial Insights in Power BI
This dashboard template transforms complex financial data into a clear strategic asset. Businesses that use it benefit:
Increased profitability through the identification of high-margin goods and services and the discovery of wasteful spending.
Stronger cash flow management through proactive monitoring of receivables, payables, and cash conversion cycles.
Enhanced budgetary control with real-time visibility into departmental spending against forecasts.
Reliable financial trend data is used in well-informed strategic planning to direct investments and expansion plans.
Financial reporting that is transparent, easy to access, and consistent is necessary for regulatory and audit readiness.
It's your company's financial command centre for boosting profitability, guaranteeing stability, and directing sustainable growth—it's more than just a dashboard.
What’s Included
Template file (.pbix) for the Power BI Financial Performance Dashboard
Excel format sample dataset (for demonstration)
Complete User Guide in PDF format with setup guidelines
Customisation support is available upon request.
Technical Details
File Type: pbix
Software Required: Microsoft Power BI Desktop (Free)
Data Source Compatibility: Excel, CSV, SQL Database, and major ERP/accounting systems (e.g., QuickBooks, Xero, SAP).
Compatibility: Power BI Desktop (the most recent version is advised)
Skill Level: Beginner to Intermediate users
Customize Dashboard at an Affordable Price
Frequently asked questions
Yes. The included User Guide PDF provides step-by-step instructions on how to connect the dashboard and update it with your own data sources quickly and easily.
The dashboard reflects the data you connect and refresh. For true real-time data streaming, this can be enabled with a Power BI Pro/PPU license and a custom data gateway setup (assistance available upon request).
Absolutely. The dashboard is fully editable within Power BI Desktop. You can modify visuals, add or remove Key Performance Indicators (KPIs), and adjust filters to meet your specific reporting needs.
The template comes pre-built with a comprehensive set of relevant metrics for its category, such as performance trends, conversion rates, cost analysis, and demographic breakdowns. The specific list is detailed in the dashboard description.
No. You can open, edit, and interact with the dashboard using the free Power BI Desktop application. A Power BI Pro or Premium Per User (PPU) license is only required to share and publish reports securely with other users within your organization.