


Every successful business has a portfolio of investments and assets, each with a unique history of value creation, performance, and utilisation. However, these tales are still hidden behind intricate spreadsheets and disjointed operational reports in many organisations.
These hidden operational narratives are turned into potent business intelligence by the Power BI Goods and CAB Analysis Dashboard. It transforms unprocessed asset management and capital appropriation data into a dynamic narrative about how you use your resources, showing which assets are increasing productivity, where budgets are yielding the highest returns, and how your capital investments are doing.
Imagine being able to view the entire operational picture in a single dynamic visual interface, including asset utilisation rates, maintenance costs, capital budget adherence, and investment ROI. Operations managers and financial leaders can now move from reactive reporting to proactive asset strategy with this all-inclusive analytics dashboard, where each figure represents a vital business resource and every insight propels operational excellence.
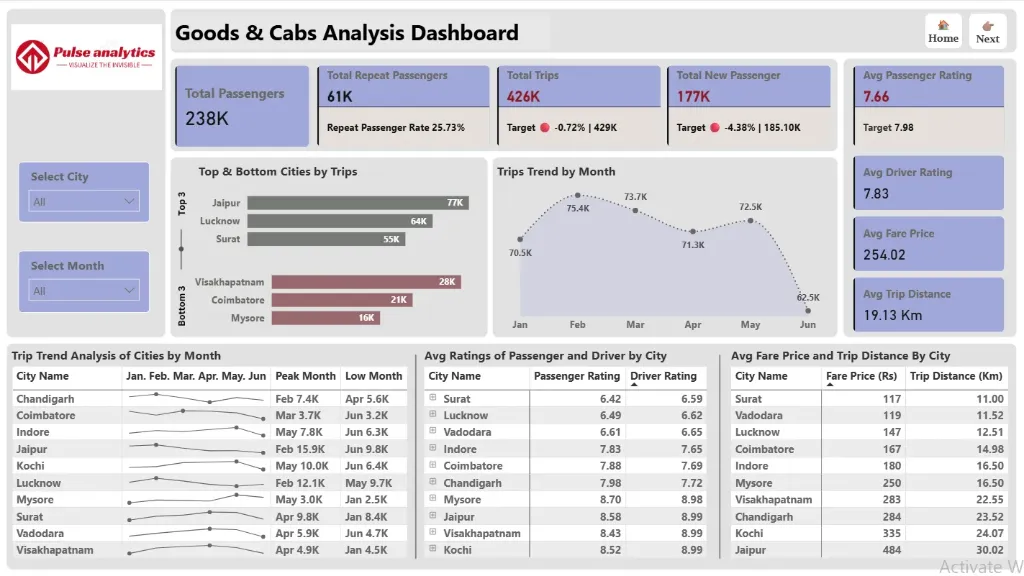
Discover important operational and financial insights, such as trends in asset utilisation, maintenance cost analysis, capital budget performance, investment return metrics, and departmental allocation efficiency, all beautifully visualised.
Benefits of this Goods & CAB Analysis Dashboard Power BI Template
Get a unified 360° operational view of asset utilization, maintenance status, and capital budget performance in a single pane.
Identify underutilized assets and budget overruns to optimize your operational strategy and capital allocation.
Measure asset efficiency and ROI with clear visual comparisons of utilization rates, maintenance costs, and project budget adherence.
Improve financial planning and oversight with data-driven insights into capital expenditure trends, budget vs. actuals, and investment returns.
Enhance management and stakeholder reporting with a ready-to-present, interactive KPI dashboard built on Power BI.
Save countless hours of manual data compilation with an automated, fully editable operational and financial analytics template.
Who Can Use This Template
Operations & Plant Managers to track asset utilization, maintenance schedules, and operational efficiency at a glance.
Finance Managers & CFOs to monitor capital budget (CAB) adherence, expenditure trends, and return on investment for projects.
Asset Management Teams to analyze equipment performance, lifecycle costs, and maintenance history for better planning.
Project Managers & Business Executives to use it as a pre-built, professional template for tracking capital projects and justifying future investments.
How to Use This Template
Download the Power BI Goods & CAB Analysis Dashboard Template (.pbix) file.
Open it in Microsoft Power BI Desktop.
Connect your data sources (ERP, asset management software, financial systems) using the included User Guide PDF.
Customize metrics, visuals, and filters to match your specific assets, projects, and financial KPIs.
Refresh the dashboard to automatically generate updated operational and financial insights for strategic reviews.
Detailed Description: Asset & Budget Analytics Made Simple
The Power BI Goods and CAB Analysis Dashboard consolidates all essential operational and capital financial metrics into a single, coherent story. With comprehensive visuals for asset utilization rates, maintenance cost analysis, capital project status, budget vs. actual spend, and investment ROI, this dashboard delivers a complete 360° view of your physical and financial resources. Operations and finance teams can track the performance and cost of assets throughout their lifecycle, pinpoint which projects are on budget, and uncover areas of financial leakage or inefficiency. Whether you're analyzing the ROI of a recent capital investment or planning the next fiscal year's budget, this dashboard enables you to move beyond siloed data and make every decision data-driven and strategically aligned.
Business Impact of Operational & Financial Insights in Power BI
This dashboard template transforms asset and budget data into a foundation for operational excellence. Organizations using it gain:
Reduced Operational Costs by identifying and addressing underperforming or high-maintenance assets.
Improved Capital Budget Adherence through real-time tracking of expenditures against approved appropriations.
Enhanced Investment Decision-Making with clear visibility into the historical performance and returns of capital projects.
Increased Asset Lifespan & Reliability through proactive maintenance scheduling based on data-driven insights.
Strategic Financial Oversight with executive-ready visuals that connect operational asset management to financial outcomes.
It's more than a dashboard - it's your command center for maximizing the value of your assets and ensuring every capital dollar is working effectively.
What’s Included
Power BI Goods & CAB Analysis Dashboard Template file (.pbix)
Sample Dataset in Excel format (for demonstration)
Comprehensive User Guide PDF with setup instructions
Support for customization available upon request
Technical Details
File Format: .pbix
Software Required: Microsoft Power BI Desktop (Free)
Data Source Compatibility: Excel, CSV, SQL Database, and major ERP/asset management systems through API connections
Compatibility: Power BI Desktop (latest version recommended)
Skill Level: Beginner to Intermediate users
Customize Dashboard at an Affordable Price
Frequently asked questions
Yes. The included User Guide PDF provides step-by-step instructions on how to connect the dashboard and update it with your own data sources quickly and easily.
The dashboard reflects the data you connect and refresh. For true real-time data streaming, this can be enabled with a Power BI Pro/PPU license and a custom data gateway setup (assistance available upon request).
Absolutely. The dashboard is fully editable within Power BI Desktop. You can modify visuals, add or remove Key Performance Indicators (KPIs), and adjust filters to meet your specific reporting needs.
The template comes pre-built with a comprehensive set of relevant metrics for its category, such as performance trends, conversion rates, cost analysis, and demographic breakdowns. The specific list is detailed in the dashboard description.
No. You can open, edit, and interact with the dashboard using the free Power BI Desktop application. A Power BI Pro or Premium Per User (PPU) license is only required to share and publish reports securely with other users within your organization.