Every successful hotel has a unique pattern of occupancy, spending, and satisfaction, as well as a tale of guest journeys and revenue streams. However, these tales are still hidden behind static financial reports and disjointed PMS systems in many hospitality organisations.
The Power BI Hotel Revenue Dashboard turns these untold stories about hospitality into useful business data. It transforms unprocessed property management data into an engaging narrative about your hotel's performance, showing which market niches are generating profits, where room rate opportunities are being lost, and how your revenue strategies are working.
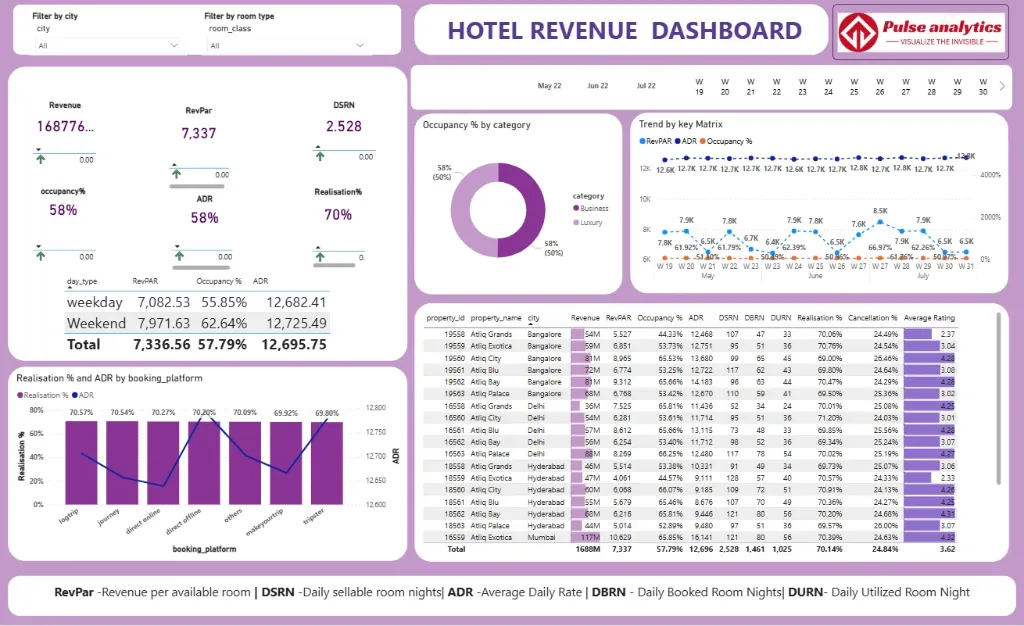
Imagine being able to view every aspect of the hospitality industry in one dynamic visual interface, including market segment contribution, revenue per available room (RevPAR) performance, average daily rate (ADR) trends, and fluctuating occupancy rates. Hotel managers and revenue leaders can finally move from reactive reporting to proactive revenue strategy with this all-inclusive analytics dashboard, where every insight drives revenue optimisation and every number tells a story of guest demand.
Discover important hotel performance insights, such as daily occupancy trends, average daily rate (ADR) analysis, revenue per available room (RevPAR), market segment performance, booking channel contribution, and pace versus forecast comparisons, all beautifully visualised.
Benefits of this Hotel Revenue Dashboard Power BI Template
Get a unified 360° revenue view across all departments rooms, F&B, spa, and events - in a single, interactive pane.
Identify high-performing market segments and pricing opportunities to optimize your yield management strategy and resource allocation.
Measure hotel performance with clear visual comparisons of Occupancy Rate, Average Daily Rate (ADR).
Improve dynamic pricing decisions with data-driven insights into booking pace, market demand, and competitor rate intelligence.
Enhance ownership and management reporting with a ready-to-present, executive-level KPI dashboard built on Power BI.
Save countless hours of manual report compilation with an automated, fully editable hospitality analytics template.
Who Can Use This Template
Hotel General Managers to track overall property performance, guest satisfaction scores, and departmental profitability at a glance.
Revenue Managers to monitor booking channels performance, market segment contribution, and pricing strategy effectiveness.
Sales & Marketing Directors to analyze corporate account performance, group business value, and marketing campaign ROI.
Hotel Owners & Asset Managers to use it as a pre-built, professional template for investment reviews and portfolio performance analysis.
How to Use This Template
Download the Power BI Hotel Revenue Dashboard Template (.pbix) file.
Open it in Microsoft Power BI Desktop.
Connect your Property Management System (PMS), point-of-sale systems, and channel manager data using the included User Guide PDF.
Customize metrics, visuals, and filters to match your specific room types, rate plans, and reporting requirements.
Refresh the dashboard to automatically generate updated revenue insights and performance analytics for daily operations and strategic reviews.
Detailed Description: Hotel Revenue Analytics Made Simple
The Power BI Hotel Revenue Dashboard consolidates all essential hospitality metrics into a single, coherent story. With comprehensive visuals for daily occupancy trends, ADR performance, RevPAR analysis, market segment contribution, and booking channel distribution, this dashboard delivers a complete 360° view of your property's financial health. Revenue teams and hotel executives can track booking patterns from initial reservation to final checkout, identify which market segments deliver the most value, and uncover potential revenue leakage points. Whether you're analyzing pace performance or optimizing your distribution strategy, this dashboard enables you to move beyond scattered reports and make every commercial decision data-driven and profit-focused.
Business Impact of Revenue Insights in Power BI
This dashboard template transforms hotel operational data into your most valuable strategic asset. Organizations using it gain:
Maximized Total Revenue by identifying upselling opportunities and optimizing rate positioning across all segments.
Improved Market Share through proactive demand forecasting and strategic competitor pricing analysis.
Enhanced Distribution Efficiency by identifying high-performing booking channels and optimizing commission costs.
Better Resource Allocation through clear visibility into departmental performance and seasonal demand patterns.
Data-Driven Strategy with executive-ready visuals that connect daily operations to financial outcomes.
It's more than a dashboard - it's your hotel's revenue command center for driving profitability, optimizing distribution, and achieving competitive advantage in the market.
What's Included
Power BI Hotel Revenue Dashboard Template file (.pbix)
Sample Dataset in Excel format (for demonstration)
Comprehensive User Guide PDF with setup instructions
Support for customization available upon request
Technical Details
File Format: .pbix
Software Required: Microsoft Power BI Desktop (Free)
Data Source Compatibility: Excel, CSV, SQL Database, and major PMS systems (e.g., Opera, Protel) through API connections
Compatibility: Power BI Desktop (latest version recommended)
Skill Level: Beginner to Intermediate users
Customize Dashboard at an Affordable Price
Frequently asked questions
Yes. The included User Guide PDF provides step-by-step instructions on how to connect the dashboard and update it with your own data sources quickly and easily.
The dashboard reflects the data you connect and refresh. For true real-time data streaming, this can be enabled with a Power BI Pro/PPU license and a custom data gateway setup (assistance available upon request).
Absolutely. The dashboard is fully editable within Power BI Desktop. You can modify visuals, add or remove Key Performance Indicators (KPIs), and adjust filters to meet your specific reporting needs.
The template comes pre-built with a comprehensive set of relevant metrics for its category, such as performance trends, conversion rates, cost analysis, and demographic breakdowns. The specific list is detailed in the dashboard description.
No. You can open, edit, and interact with the dashboard using the free Power BI Desktop application. A Power BI Pro or Premium Per User (PPU) license is only required to share and publish reports securely with other users within your organization.