


Behind every successful business lies a team of people, each with their own story of growth, performance, and potential. Yet, in many organizations, these stories get buried beneath endless spreadsheets and static reports.
The Power BI HR Analytics Dashboard turns those hidden human stories into powerful business insights. It transforms raw HR data into a living narrative of your workforce, revealing who's driving performance, where engagement is slipping, and how your talent is evolving.
Imagine seeing the complete workforce picture, from rising attrition trends and diversity gaps to top-performing departments and compensation benchmarks, all in one dynamic visual interface. With this comprehensive analytics dashboard, HR leaders can finally transition from reactive administration to proactive talent strategy, where every number reflects a person, and every insight drives meaningful action.
Explore key workforce insights, beautifully visualized, including headcount trends, attrition rates, diversity metrics, performance ratings, compensation analysis, tenure distribution, recruitment efficiency, and departmental workforce health.
Benefits of this HR Analytics Dashboard Power BI Template
Get a unified 360° workforce view across all critical dimensions—headcount, talent, performance, and culture—in a single pane.
Identify retention risks and high-potential talent to optimize your workforce planning and succession strategy.
Measure HR program effectiveness with clear visual comparisons of attrition trends, time-to-fill metrics, training completion, and engagement scores.
Improve diversity, equity, and inclusion (DEI) initiatives with data-driven insights into representation gaps, promotion rates, and pay equity.
Enhance executive and board reporting with a ready-to-present, strategic HR dashboard built on Power BI.
Save countless manual hours on HR reporting with an automated, fully editable people analytics template.
Who Can Use This Template
CHROs & HR Directors to track workforce health, HR program ROI, and talent metrics at a strategic level.
Talent Acquisition Leaders to monitor recruitment funnel efficiency, source quality, and time-to-hire metrics.
People Analytics Specialists to analyze attrition drivers, employee engagement trends, and workforce planning scenarios.
Business Unit Leaders to use it as a pre-built template for understanding their team's composition, performance, and development needs.
How to Use This Template
Download the Power BI HR Analytics Dashboard Template (.pbix) file.
Open it in Microsoft Power BI Desktop.
Connect your HRIS data (Workday, SAP SuccessFactors, BambooHR) and employee survey data using the included User Guide PDF.
Customize metrics, visuals, and filters to match your specific organizational structure, job families, and reporting requirements.
Refresh the dashboard to automatically generate updated people insights for leadership reviews and strategic planning sessions.
Detailed Description: People Analytics Made Simple
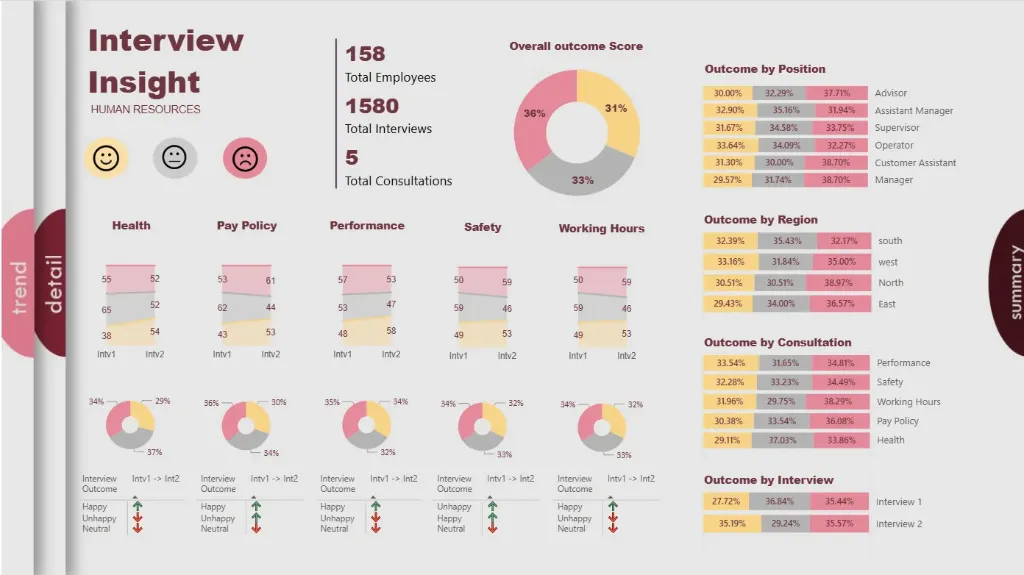
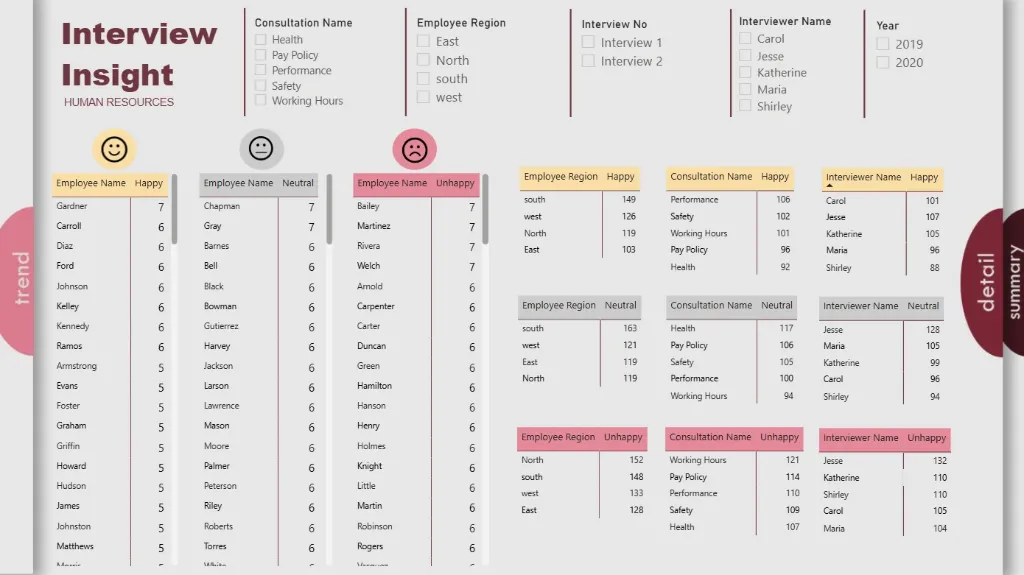
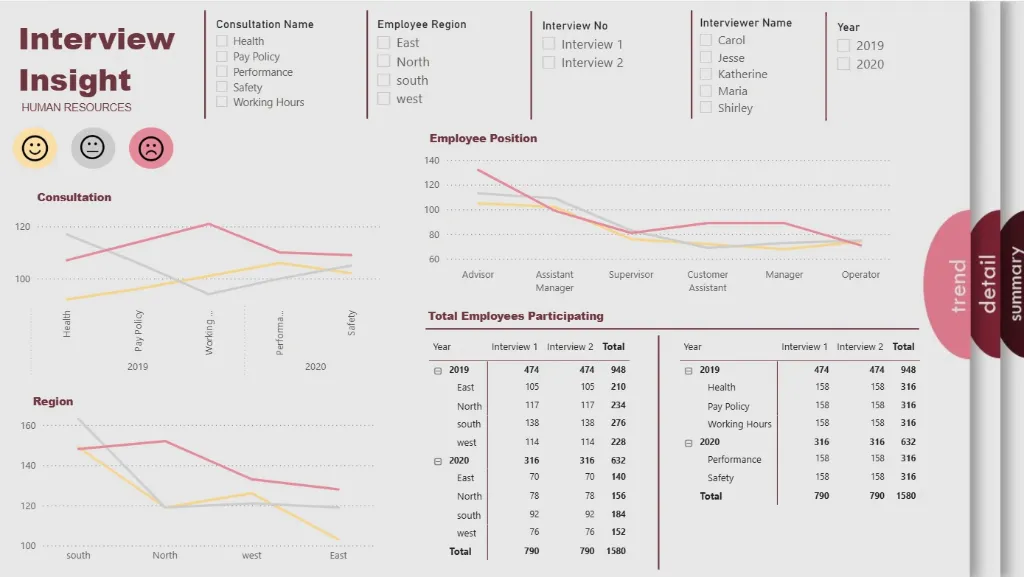
The Power BI HR Analytics Dashboard consolidates all essential workforce metrics into a single, coherent story. With comprehensive visuals for headcount distribution, voluntary vs. involuntary turnover, diversity dashboards, performance calibration, and compensation ratios, this dashboard delivers a complete 360° view of your organization's human capital. HR business partners and leaders can track employee journeys from hire to retire, identify which departments have the highest flight risk, and uncover equity issues in promotions or pay. Whether you're analyzing the impact of a new engagement survey or planning for future talent needs, this dashboard enables you to move beyond transactional HR data and make every people decision data-driven and employee-centric.
Business Impact of People Analytics in Power BI
This dashboard template transforms HR data into a strategic business asset. Organizations using it gain:
Reduced Turnover Costs by identifying and addressing the root causes of attrition proactively.
Improved Talent Decisions through data-backed insights into hiring, promotions, and development.
Enhanced Employee Experience by measuring and acting on engagement and satisfaction drivers.
Better Workforce Planning with clear visibility into skills gaps, succession readiness, and headcount forecasts.
Strategic HR Leadership with executive-ready visuals that demonstrate the people impact on business outcomes.
It's more than a dashboard—it's your HR team's mission control for building a high-performing, engaged, and equitable workforce that drives sustainable business success.
What's Included
Power BI HR Analytics Dashboard Template file (.pbix)
Sample HR Dataset in Excel format (for demonstration)
Comprehensive User Guide PDF with step-by-step setup instructions
Support for customization available upon request
Technical Details
File Format: .pbix
Software Required: Microsoft Power BI Desktop (Free)
Data Source Compatibility: Excel, CSV, SQL Database, and major HRIS platforms (Workday, SAP, Oracle HCM) through API connections
Compatibility: Power BI Desktop (latest version recommended)
Skill Level: Beginner to Intermediate users
Customize Dashboard at an Affordable Price
Frequently asked questions
Yes. The included User Guide PDF provides step-by-step instructions on how to connect the dashboard and update it with your own data sources quickly and easily.
The dashboard reflects the data you connect and refresh. For true real-time data streaming, this can be enabled with a Power BI Pro/PPU license and a custom data gateway setup (assistance available upon request).
Absolutely. The dashboard is fully editable within Power BI Desktop. You can modify visuals, add or remove Key Performance Indicators (KPIs), and adjust filters to meet your specific reporting needs.
The template comes pre-built with a comprehensive set of relevant metrics for its category, such as performance trends, conversion rates, cost analysis, and demographic breakdowns. The specific list is detailed in the dashboard description.
No. You can open, edit, and interact with the dashboard using the free Power BI Desktop application. A Power BI Pro or Premium Per User (PPU) license is only required to share and publish reports securely with other users within your organization.