


A portfolio of campaigns, each with a unique tale of reach, resonance, and return, is the foundation of any successful brand. However, these tales are obscured for a lot of marketers by a tangle of platform-specific reports and disparate data points.
These untold tales are transformed into a compelling account of your marketing efficacy by this Power BI Marketing Campaign Dashboard. It turns unprocessed campaign data into a dynamic, interactive image of your audience's journey that shows which channels are generating growth, which creatives are winning over hearts, and how well your budget is actually working.
Imagine being able to see everything in one dynamic view, including detailed demographic breakdowns, cost-effective conversions, and skyrocketing engagement rates. Marketing executives can now transition from reactive reporting to proactive strategy, where every impression is an opportunity and every insight drives more intelligent growth, thanks to this analytics dashboard.
Discover important marketing insights, such as channel-specific ROI, campaign engagement trends, cost per acquisition, demographic performance, and real-time conversion metrics, all beautifully illustrated.
Benefits of this Marketing Campaign Dashboard Power BI Template
Get a unified view of campaign performance across all key channels, including social media, search, and display advertising.
Identify high-performing audience segments and winning creative elements to refine your marketing strategy and maximize budget impact.
Measure campaign efficiency and ROI with clear visual comparisons of Return on Ad Spend (ROAS), Customer Acquisition Cost (CAC), and conversion rates.
Improve media planning decisions with data-driven insights into channel performance, geographic performance, and demographic engagement patterns.
Enhance stakeholder reporting with a ready-to-present, interactive executive dashboard built on Power BI.
Save countless hours of manual reporting with an automated, fully customisable marketing intelligence template.
Who Can Use This Template
Marketing managers & CMOs track campaign effectiveness, audience engagement, and marketing ROI at a glance.
Marketing analysts & PPC specialists to analyse channel efficiency, optimise bids, and improve targeting strategies.
Business leaders & product managers to align marketing outcomes with overall business objectives.
Digital agencies & consultants can use it as a pre-built, professional analytics template for client reporting and performance reviews.
How to Use This Template
Download the Power BI Marketing Campaign Dashboard Template (.pbix) file.
Open it in Microsoft Power BI Desktop.
Connect your marketing data sources (Google Analytics, ad platforms, CRM) using the included User Guide PDF.
Customise metrics, visuals, and filters to match your specific campaign objectives and KPIs.
Refresh the dashboard to automatically generate updated insights and share them with your team.
Detailed Description Of Campaign Analytics Made Simple
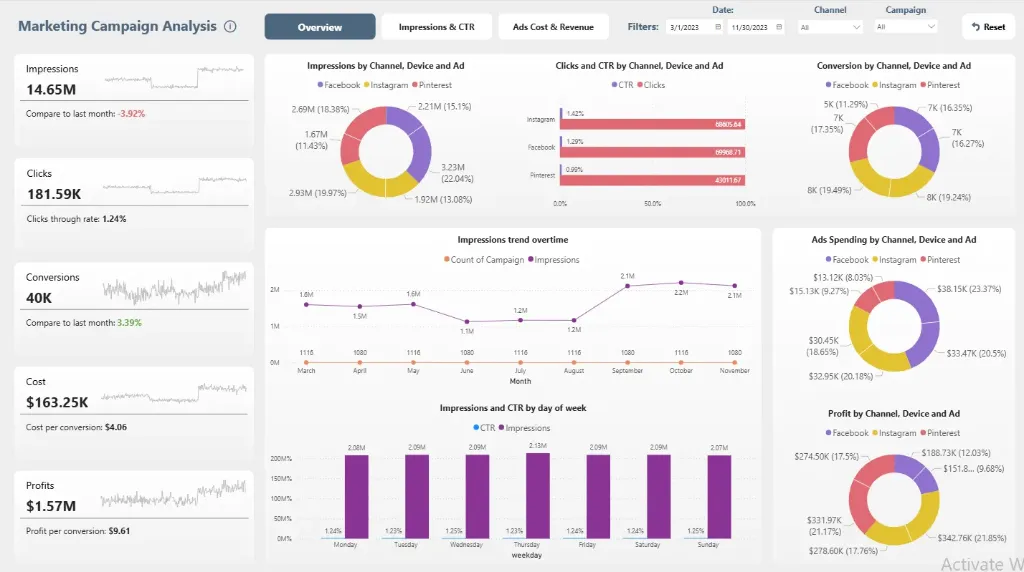
The Power BI Marketing Campaign Dashboard brings together all essential marketing metrics into a single, coherent story. With comprehensive visuals for impressions, engagement rate, conversion funnel, customer lifetime value (LTV), and channel attribution, this dashboard delivers a complete 360° view of your marketing effectiveness. Marketing teams can track campaign performance trends, identify which channels deliver the best ROI, and understand the customer journey from first touch to conversion. Whether you're optimising active campaigns or planning future marketing strategies, this dashboard enables you to move beyond guesswork and make every marketing decision insight-driven and results-orientated.
Business Impact of Campaign Insights in Power BI
This dashboard template transforms marketing data into a competitive advantage. Organisations using it gain:
Higher marketing ROI by identifying and scaling winning strategies while eliminating wasteful spending.
Improved audience targeting by discovering high-value customer segments and creating lookalike audiences.
Increased conversion rates by optimising campaigns based on performance data and customer journey analysis.
Better budget allocation through clear visibility into channel performance and cost-per-acquisition metrics.
Faster decision-making with real-time campaign performance data and automated reporting workflows.
It's more than a dashboard—it's your marketing team's command centre for driving measurable business growth.
What's Included
Power BI Marketing Campaign Dashboard Template file (.pbix)
Sample Dataset in Excel format (for demonstration)
Comprehensive User Guide PDF with setup instructions
Support for customisation is available upon request
Technical Details
File Format: .pbix
Software Required: Microsoft Power BI Desktop (Free)
Data Source Compatibility: Excel, CSV, SQL Database, and cloud services through API connections
Compatibility: Power BI Desktop (latest version recommended)
Skill Level: Beginner to Intermediate users
Customize Dashboard at an Affordable Price
Frequently asked questions
Yes. The included User Guide PDF provides step-by-step instructions on how to connect the dashboard and update it with your own data sources quickly and easily.
The dashboard reflects the data you connect and refresh. For true real-time data streaming, this can be enabled with a Power BI Pro/PPU license and a custom data gateway setup (assistance available upon request).
Absolutely. The dashboard is fully editable within Power BI Desktop. You can modify visuals, add or remove Key Performance Indicators (KPIs), and adjust filters to meet your specific reporting needs.
The template comes pre-built with a comprehensive set of relevant metrics for its category, such as performance trends, conversion rates, cost analysis, and demographic breakdowns. The specific list is detailed in the dashboard description.
No. You can open, edit, and interact with the dashboard using the free Power BI Desktop application. A Power BI Pro or Premium Per User (PPU) license is only required to share and publish reports securely with other users within your organization.