Behind every accurate financial statement lies a critical story of matching, verification, and compliance—a detailed narrative of recorded revenue versus actual cash flow. Yet, in many finance departments, this story gets lost in a labyrinth of manual spreadsheets, bank statements, and disjointed accounting entries.
The Power BI Revenue Reconciliation Dashboard transforms this complex verification process into a clear, automated story of financial integrity. It converts raw data from your ERP, payment gateways, and bank feeds into a single source of truth, revealing where discrepancies arise, which payment methods are misaligned, and how your recorded revenue matches reality.
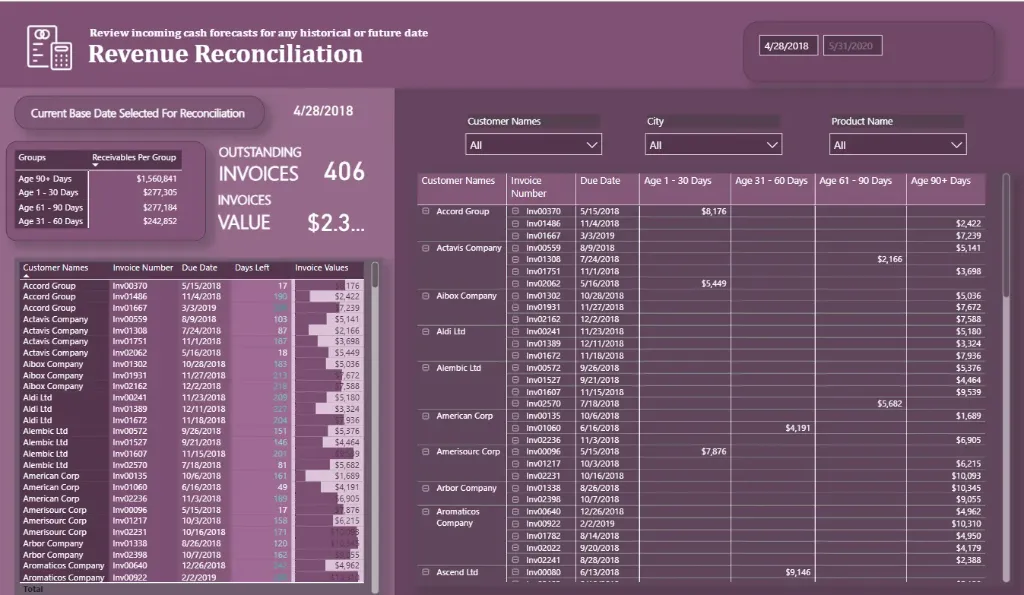
Imagine seeing the complete reconciliation picture, from high-level summary matches to granular transaction-level variances, all in one intuitive, visual interface. With this Revenue Reconciliation Dashboard, controllers and finance leaders can shift from a reactive, month-end scramble to a proactive control strategy where every dollar is accounted for, and every variance drives immediate corrective action.
Explore key reconciliation insights, beautifully visualized, including daily reconciliation status, outstanding variance amounts, payment method discrepancies, departmental revenue recognition, and aging analysis of unreconciled items.
Benefits of this Revenue Reconciliation Dashboard Power BI Template
Get a unified 360° view of all revenue streams against bank deposits and invoiced amounts in a single pane.
Identify discrepancies and variances instantly to accelerate the month-end close and ensure financial accuracy.
Measure reconciliation efficiency with clear visual comparisons of matched vs. unmatched transactions, aging of variances, and team productivity.
Improve financial controls and compliance with data-driven insights into high-risk accounts, common error types, and audit trails.
Enhance stakeholder confidence with a ready-to-present, interactive KPI dashboard built on Power BI for unparalleled transparency.
Save dozens of manual hours each month with an automated, fully editable financial reconciliation template.
Who Can Use This Template
Financial Controllers & Accounting Managers to oversee the entire reconciliation process, close status, and team workload at a glance.
Revenue Accountants & Analysts to investigate specific variances, track payment method accuracy, and clear reconciling items.
Internal & External Auditors to verify compliance, test financial controls, and review reconciliation evidence efficiently.
CFOs & Finance Directors to use it as a pre-built, professional template for board reporting and ensuring financial statement integrity.
How to Use This Template
Download the Power BI Revenue Reconciliation Dashboard Template (.pbix) file.
Open it in Microsoft Power BI Desktop.
Connect your ERP system, bank feeds, and payment gateway data using the included User Guide PDF.
Customize rules, thresholds, and visuals to match your specific chart of accounts and reconciliation policies.
Refresh the dashboard to automatically surface new variances and generate an audit-ready reconciliation report.
Detailed Description: Reconciliation Analytics Made Simple
The Power BI Revenue Reconciliation Dashboard consolidates all essential financial matching metrics into a single, coherent story. With comprehensive visuals for reconciliation completion rate, total variance by source, transaction aging reports, and payment method breakdowns, this dashboard delivers a complete 360° view of your revenue accuracy. Finance teams can track the matching process from initial recording to final bank clearance, identify which systems or processes cause the most errors, and uncover potential fraud or leakage points. Whether you're performing a daily cash reconciliation or preparing for the annual audit, this dashboard enables you to move beyond manual spreadsheets and make every control decision data-driven and risk-focused.
Business Impact of Reconciliation Insights in Power BI
This dashboard template transforms a tedious accounting task into a strategic control asset. Organizations using it gain:
Faster Financial Close by reducing the time to identify and resolve discrepancies from days to minutes.
Improved Cash Flow Accuracy through real-time visibility into collected revenue versus recorded revenue.
Enhanced Audit Compliance by maintaining a clear, automated audit trail of all reconciliation activities.
Reduced Financial Risk through the early detection of posting errors or unusual transactions.
Strategic Financial Insight with executive-ready visuals that prove revenue integrity and operational efficiency.
It's more than a dashboard—it's your finance team's control center for ensuring every dollar is accounted for, accelerating the close, and building trust with stakeholders.
What's Included
Power BI Revenue Reconciliation Dashboard Template file (.pbix)
Sample Dataset in Excel format (for demonstration)
Comprehensive User Guide PDF with step-by-step setup instructions
Support for customization available upon request
Technical Details
File Format: .pbix
Software Required: Microsoft Power BI Desktop (Free)
Data Source Compatibility: Excel, CSV, SQL Database, and major ERP & accounting systems (e.g., QuickBooks, SAP, NetSuite) through API connections
Compatibility: Power BI Desktop (latest version recommended)
Skill Level: Beginner to Intermediate users
Customize Dashboard at an Affordable Price
Frequently asked questions
Yes. The included User Guide PDF provides step-by-step instructions on how to connect the dashboard and update it with your own data sources quickly and easily.
The dashboard reflects the data you connect and refresh. For true real-time data streaming, this can be enabled with a Power BI Pro/PPU license and a custom data gateway setup (assistance available upon request).
Absolutely. The dashboard is fully editable within Power BI Desktop. You can modify visuals, add or remove Key Performance Indicators (KPIs), and adjust filters to meet your specific reporting needs.
The template comes pre-built with a comprehensive set of relevant metrics for its category, such as performance trends, conversion rates, cost analysis, and demographic breakdowns. The specific list is detailed in the dashboard description.
No. You can open, edit, and interact with the dashboard using the free Power BI Desktop application. A Power BI Pro or Premium Per User (PPU) license is only required to share and publish reports securely with other users within your organization.